Grain Markets - Summer 2025
__primary.png?v=1748622531)

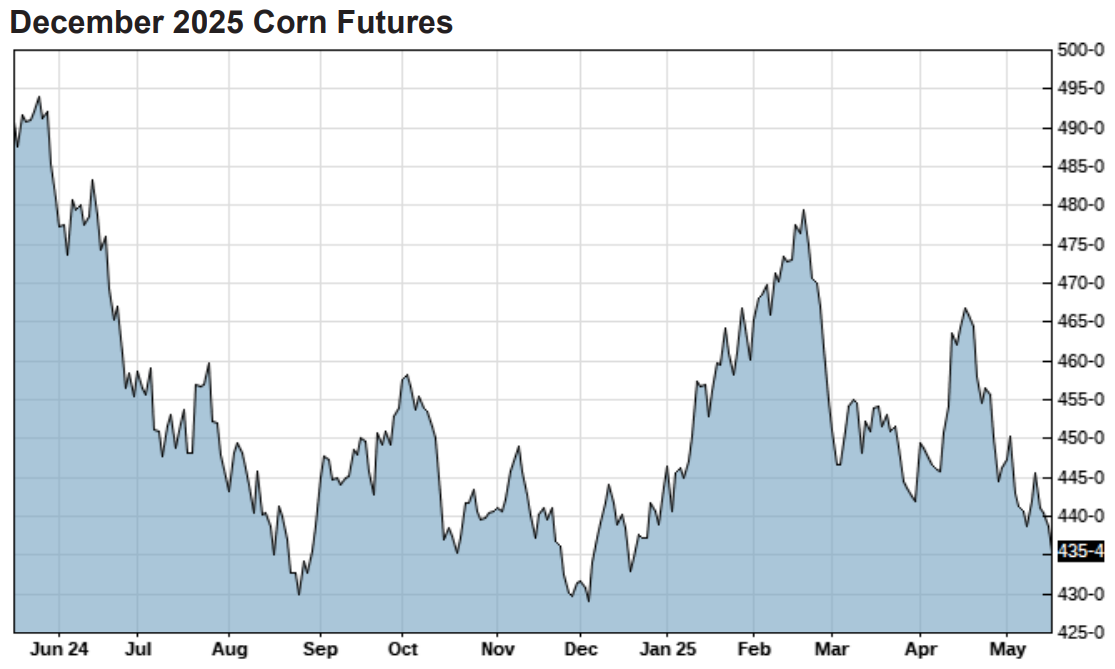
Over the past 6 months, corn and soybean markets have experienced considerable volatility, shaped by a combination of government reports, trade dynamics, and strong South American production. The USDA sparked a winter price rally, with the January report revealing that U.S. corn production fell by about 3% in 2024 to 14.8 billion bushels due to reduced acreage. This was in stark contrast to earlier reports. Strong corn demand was another contributor to price strength.
Soybean prices also increased, to compete for new crop acres, in spite of the fact the report showed soybean production up 5% in 2024, to 4.3 billion bushels, due to increased acreage.
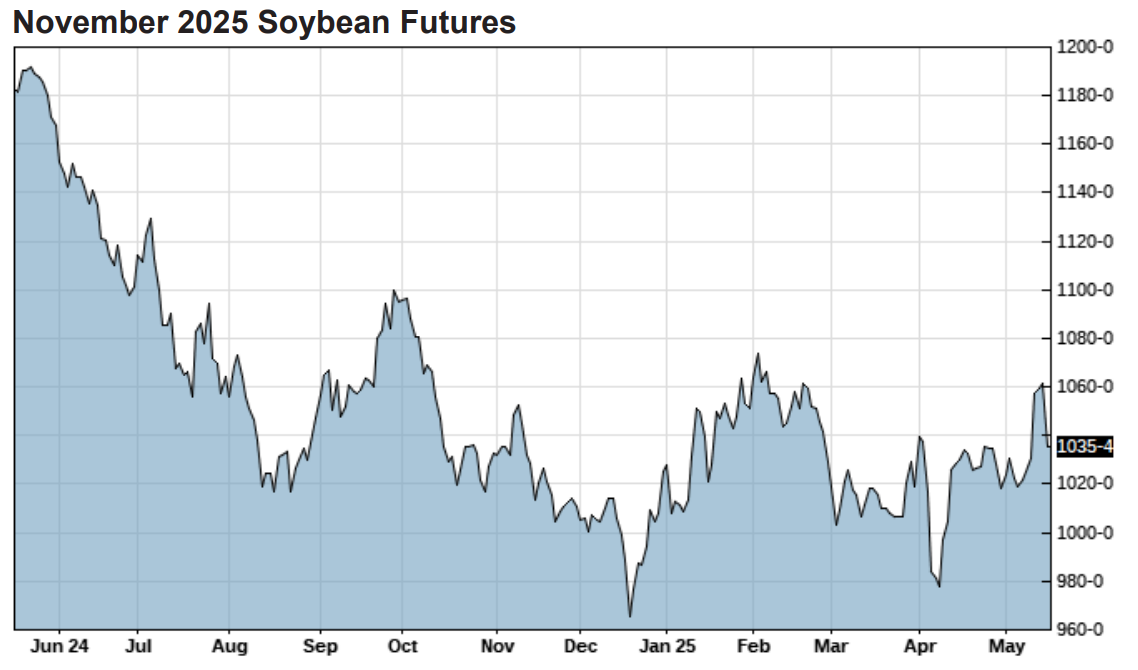
The May World Agricultural Supply and Demand Estimates (WASDE) report provided our first look at the 2025/26 marketing year which will begin September 1. The USDA estimates corn planting of 95.3 million acres, an increase of 4.7 million acres over 2024. Ethanol use was estimated to remain the same as 2024, while exports and feed/residual was projected to increase. Ending stocks for 25/26 were estimated to be 1.8 billion bushel vs 1.4 billion bushel for 24/25. On the soybean side, plantings are estimated at 83.5 million acres, a decrease of 3.6 million acres over 2024. Crush use was estimated to increase 70 million bushel over 2024, while exports, seed, and residual uses are projected to decrease slightly. Ending stocks for 25/26 were estimated to be 295 million bushel vs 350 million bushel for 24/25.
On the export front, tariff concerns and trade policy have continued to be a market moving factor. China, traditionally a significant buyer of U.S. soybeans, has scaled back purchases due in part to ongoing geopolitical tensions, reduced need due to their own economic slowdown, and cheap, ample supplies from South America. U.S. and China have agreed to a 90-day tariff pause sparking optimism on both sides that cooler heads will prevail. Japan has shown renewed interest in increasing corn imports from the U.S. but Mexico continues to be our largest customer for corn by a large margin. Overall, export demand remains strong for corn and somewhat less certain for soybeans. Any changes to trade agreements or tariffs will have immediate implications for corn and soybean prices.
Ethanol and renewable diesel have also been key demand-side drivers for corn and soybeans. The USDA estimates corn used for ethanol at 5.5 billion bushels for the 2024–25 marketing year, reflecting stable domestic demand. Additionally, renewable diesel production, fueled by both state mandates and federal incentives, continues to support soybean demand, though any policy shifts could alter this landscape quickly. There seems to be a consensus that we will see a considerable increase in renewable volume obligations from the EPA sometime this summer.
Internationally, Brazil’s growing role as a global agricultural powerhouse continues to shape market fundamentals. This year, Brazil’s soybean production could exceed 6.4 billion bushels, up from last year’s record of 6.2 billion bushels, while corn output is projected near 5.1 billion bushels. With much of that corn coming from their safrinha crop, Brazil remains a formidable competitor in global export markets, often undercutting U.S. prices and limiting market share for American producers.
As we look toward the summer and fall, seasonal patterns suggest that corn and soybean prices often rally into mid-summer due to weather risks ahead of the pollination and pod-filling stages. U.S. weather, global production, and trade developments will all play a role in determining price direction.
Related Articles